Working prototype: Power Measurement Proxy
Why a Power Measurement Proxy?
While there exist easy and accessible ways to estimate power consumption (and CO₂e emissions) for a webpage on the basis of server infrastructure, location and data transfer, assessing the power consumption of a webpage on the client (somebody's device e.g. a laptop or smartphone) requires more profound knowledge. This prototype aims to simplify this process by providing a proxy that measures power consumption on the client side while loading and using a webpage.
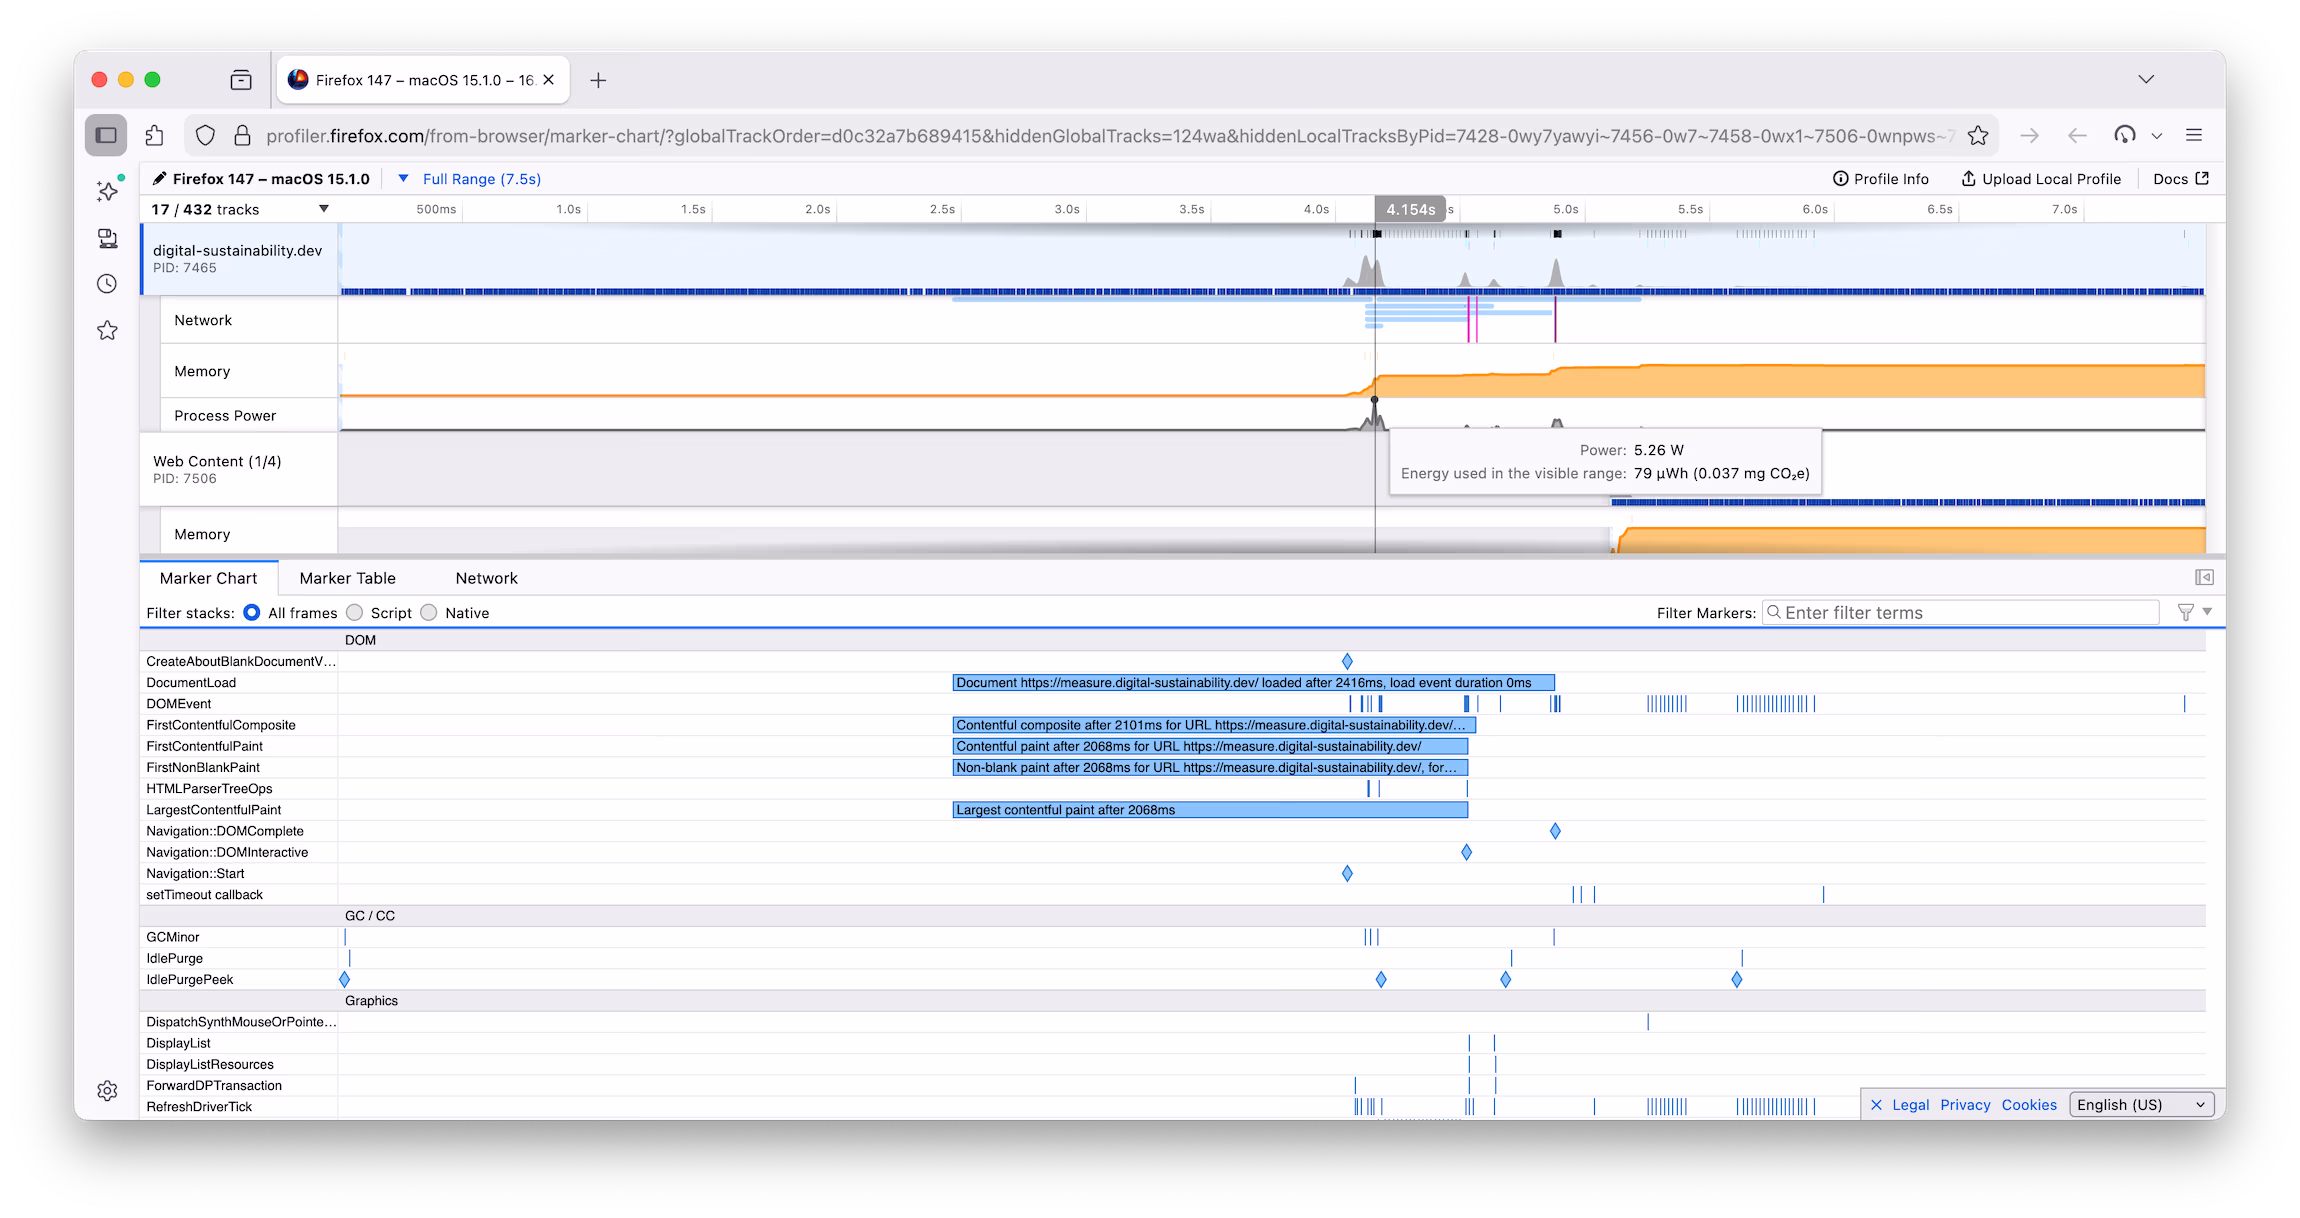
One way to measure the power consumption of a webpage would be to use Firefox`s Profiler which has a built-in functionality to measure power consumption. However, using the Firefox Profiler requires some technical knowledge and is not very accessible to everyone. Therefore, this prototype aims to provide a more user-friendly way for designers and developers building digital products.
The Goal
In my experience, designers and developers, when designing digital products and services, often don`t think about the impact of their designs on power consumption and therefore on the environment. But even if, it is pretty difficult to get feeling for the impact of different design changes. Some might know that the fewer data is transferred the better it is for the planet. For this (and more metrics) there is already a very good tool available: Website Carbon Calculator. But what it means for the energy consumption on the users device if one adds a loading animation, plays audio or has a moving background is very darn difficult to know. This is where this prototype steps in and helps designers and developers to get a feeling for how design changes impact energy consumption on the client.
A few numbers
Comparing two pages, one with a power consumption of 0.002150Wh and the other with 0.000684Wh over a time period of approximately 20s. A difference of 0.001466Wh. This is a very low number, but assuming we would have that delta on a site like the google search page, which is called more than 82,300,000,000 Source times a year. This results in a difference of 120'652kWh. With this amount of energy one could power around 24 average Swiss households (5000kWh) for a whole year Source). This shows how even small changes can have a big impact when scaled.
Procedure
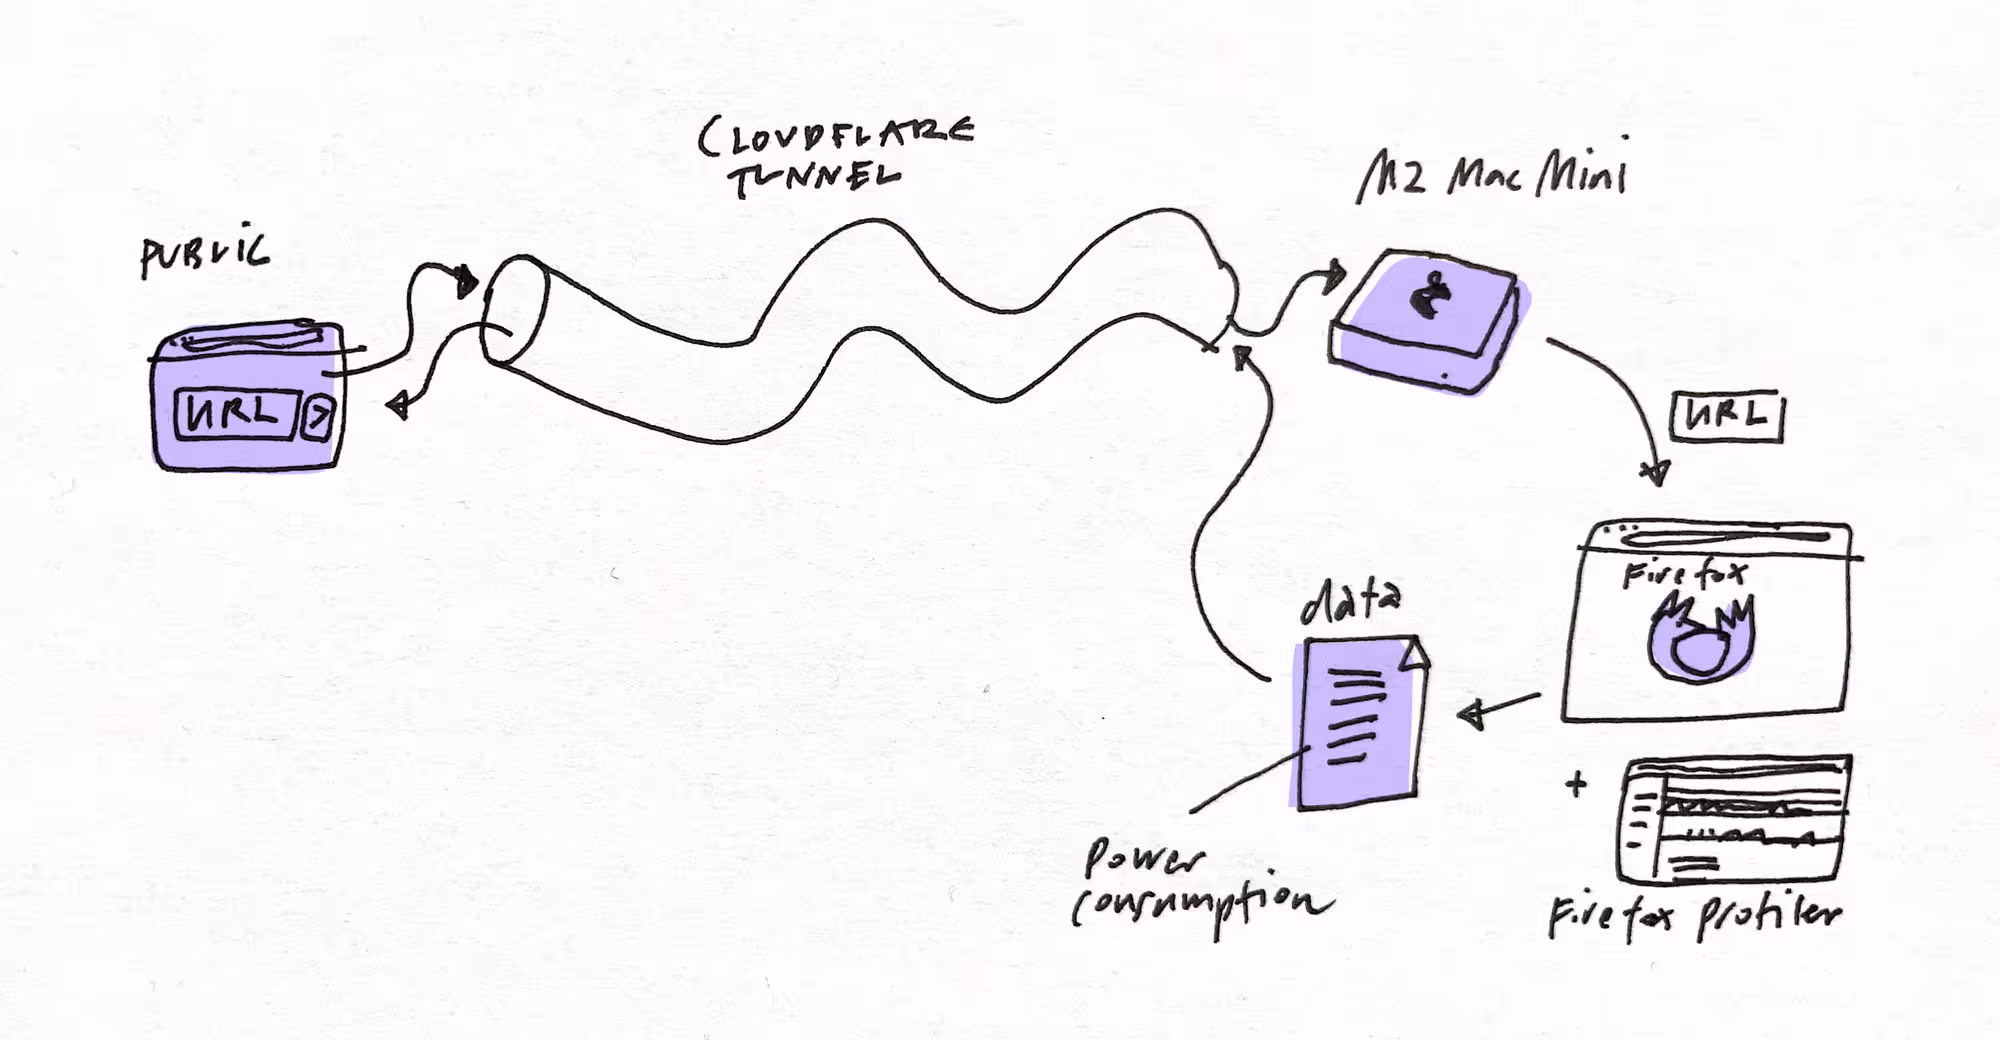
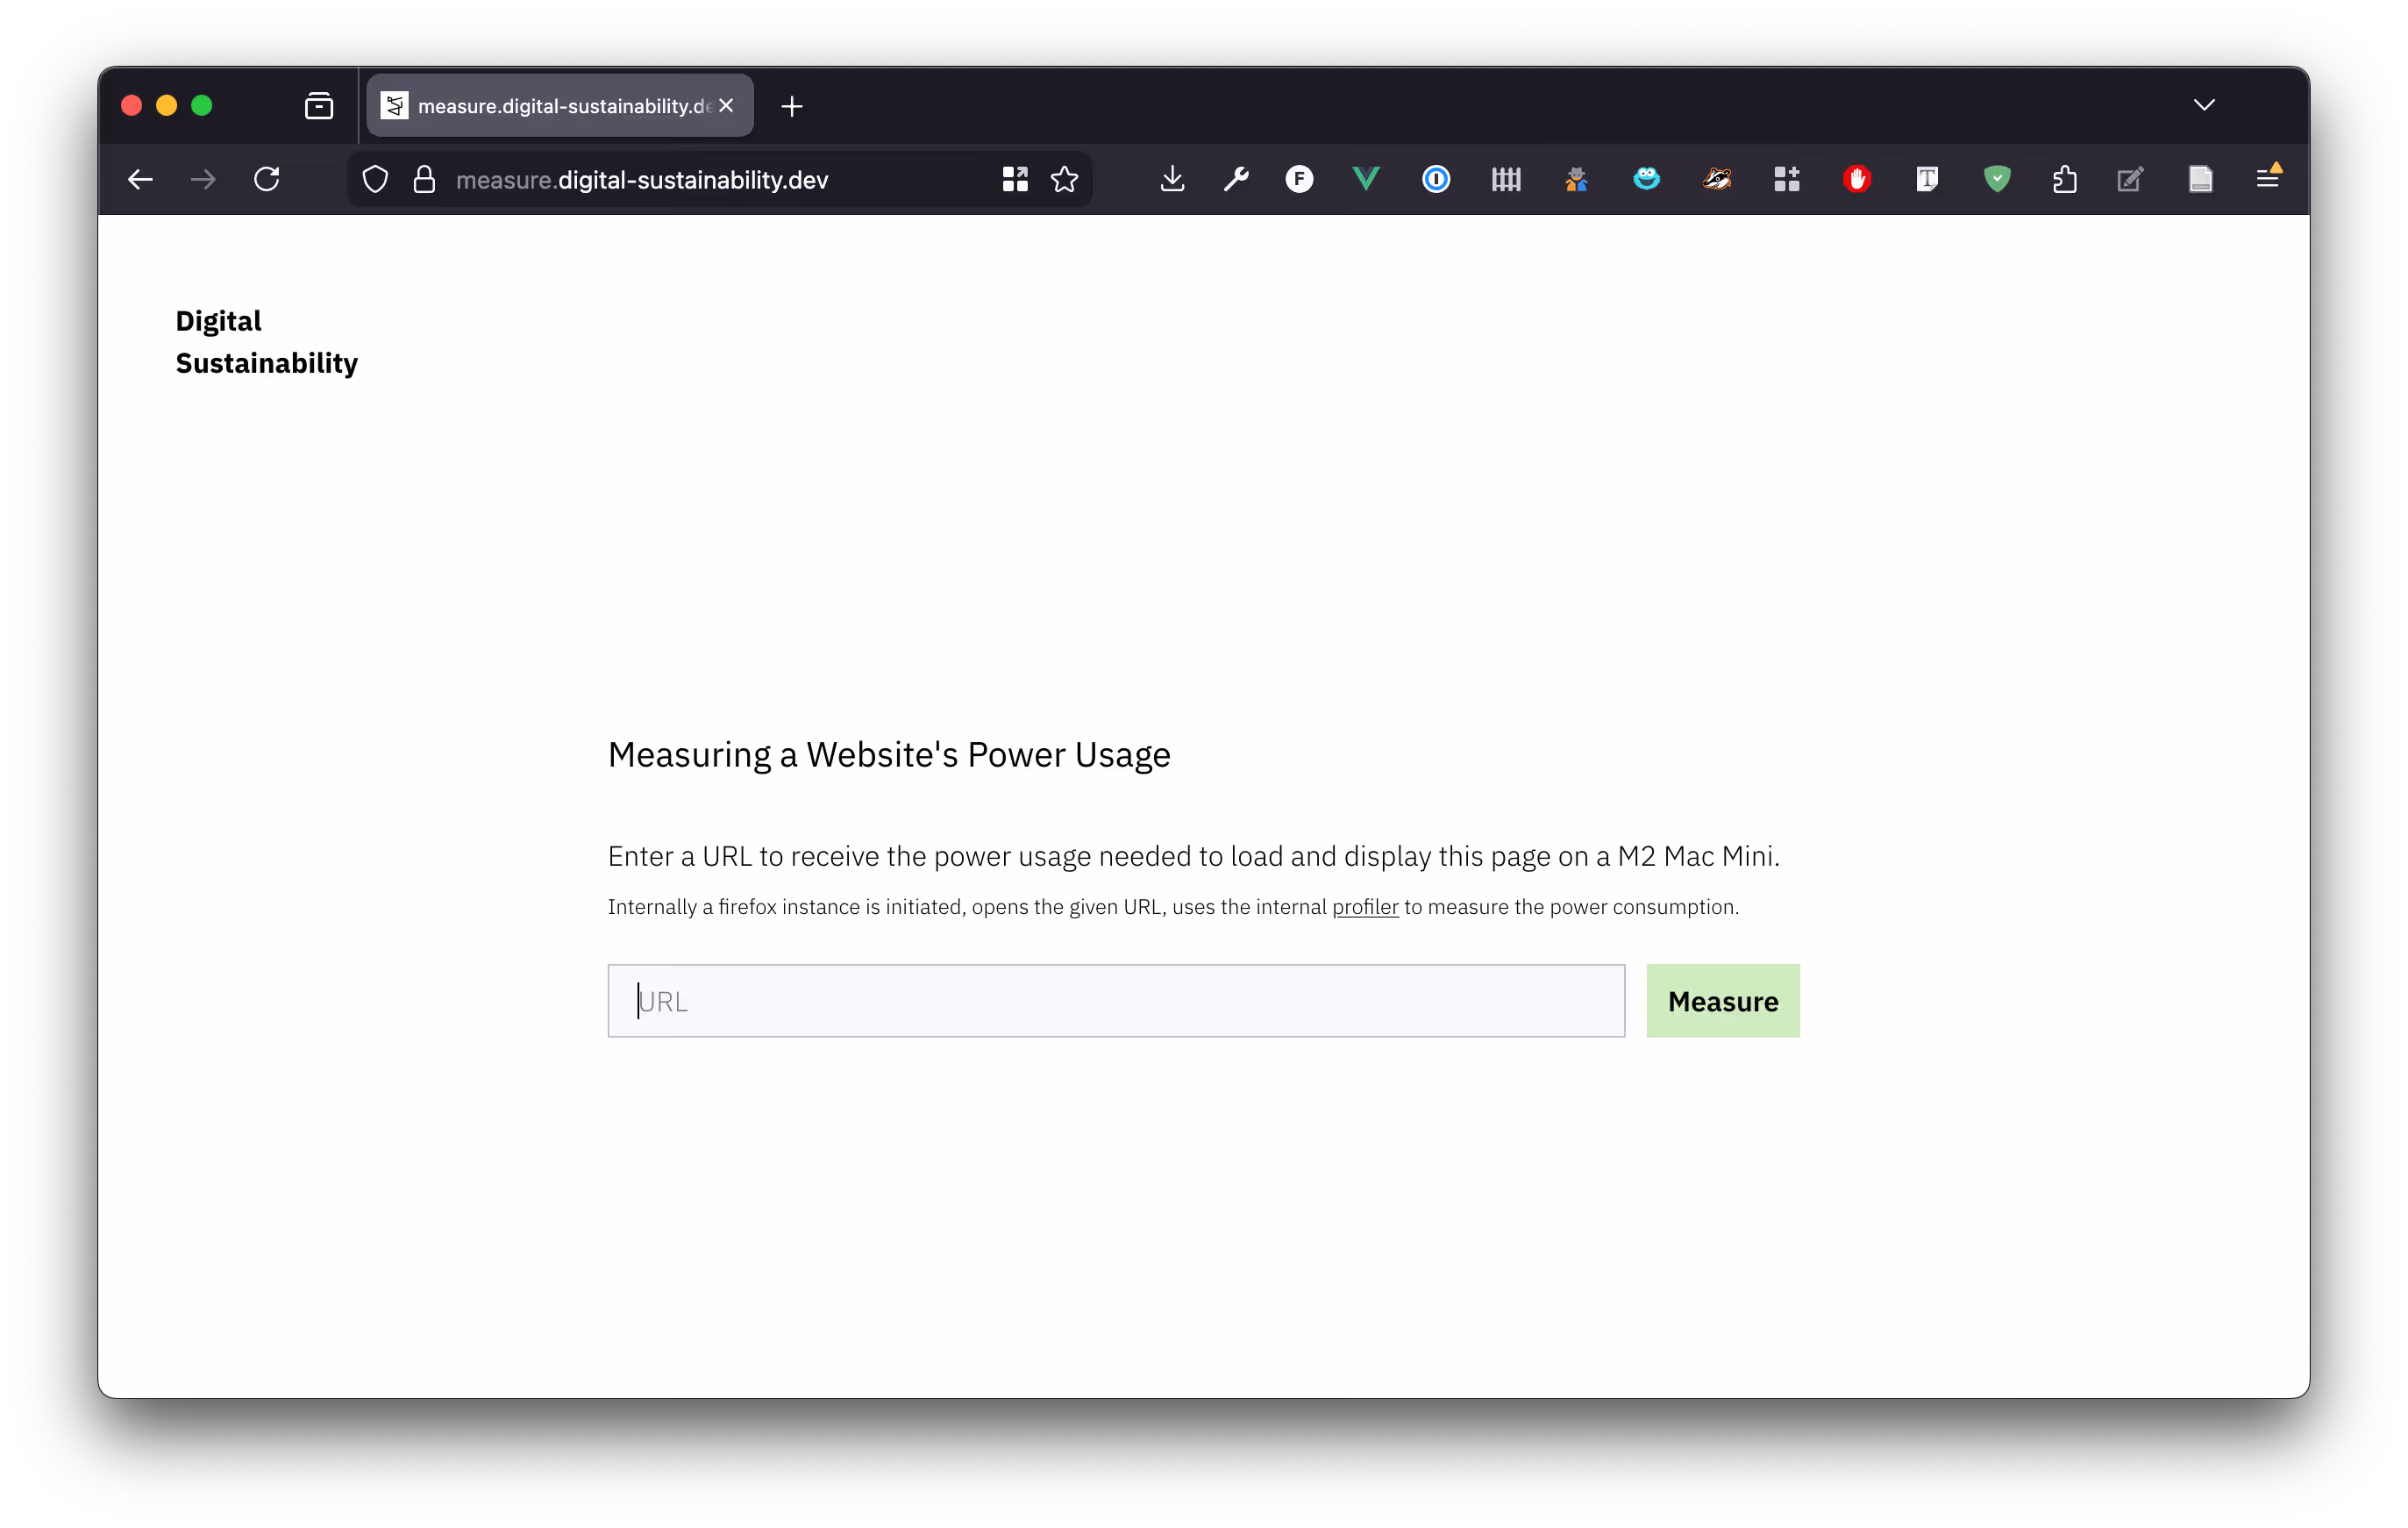
- The user navigates to the public web interface at measure.digital-sustainability.dev and enters a URL to measure the power consumption of it.
- The URL is then sent via a cloudflare tunnel to a M2 Mac Mini just used for that purpose.
- The Mac Mini runs a local process waiting for incoming requests. If a URL is received, the proxy automates opening up a firefox window with it`s extensive profiler, reading out the relevant values by making use of sitespeed—which is used for automation and collecting performance metrics—and especially browsertime.
- After collection the data is sent back to the web interface informing the user.
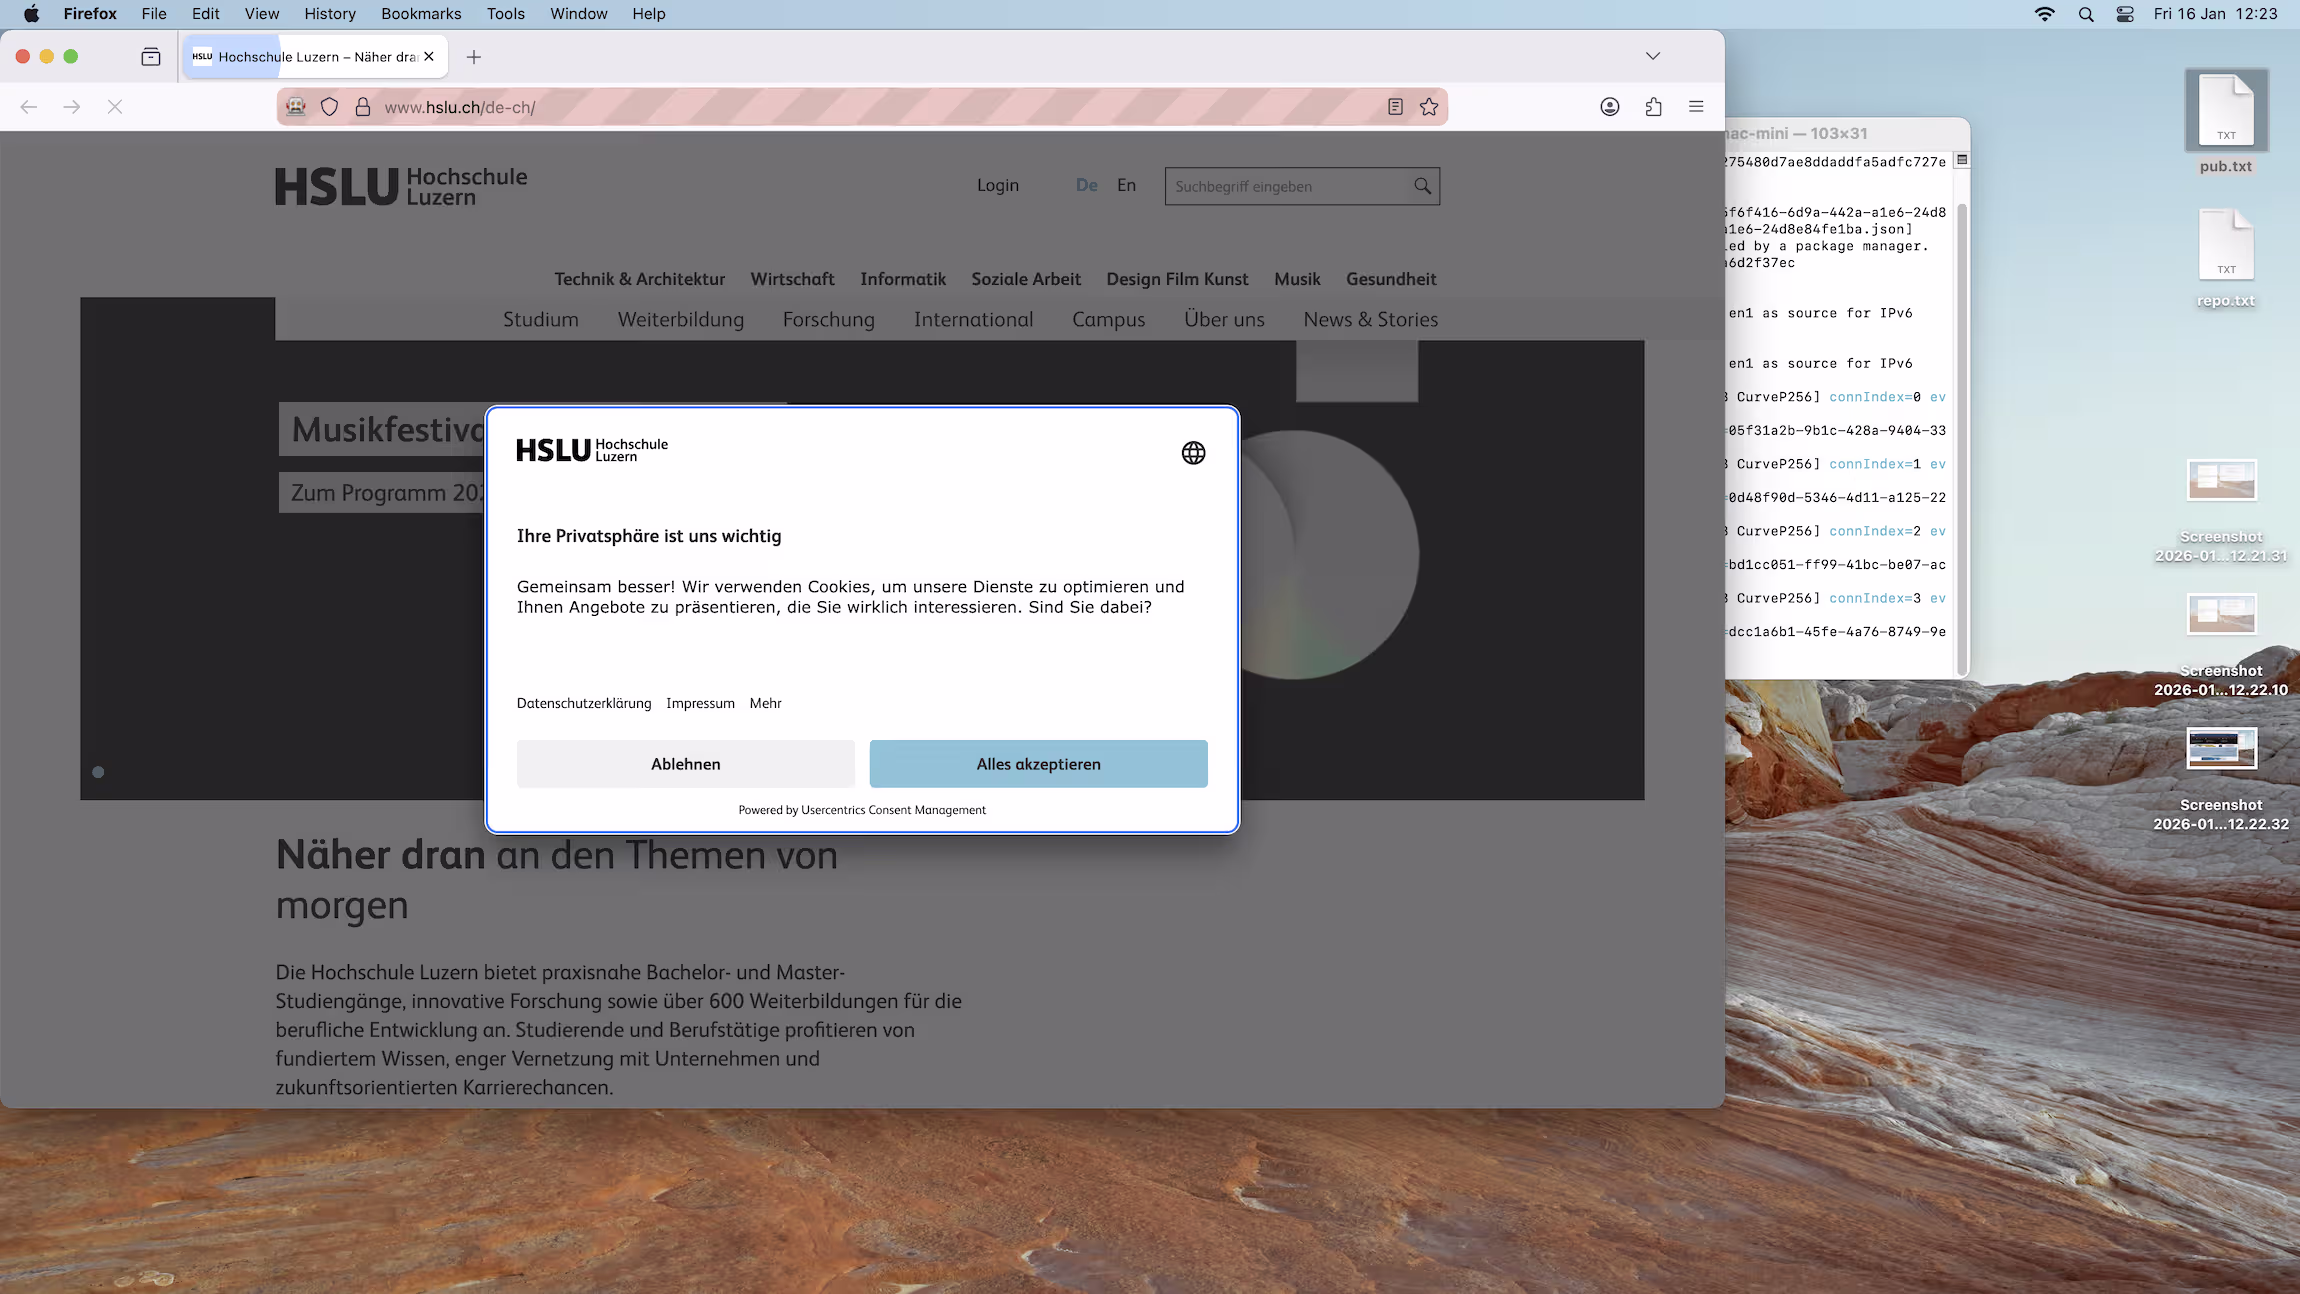
To collect the most accurate values, only one firefox instance is run at once and except from the running express server no other tasks should run. To do so, the express server queues incoming requests and only opens one at a time.
The open source code can be found at GitHub.
Outlook
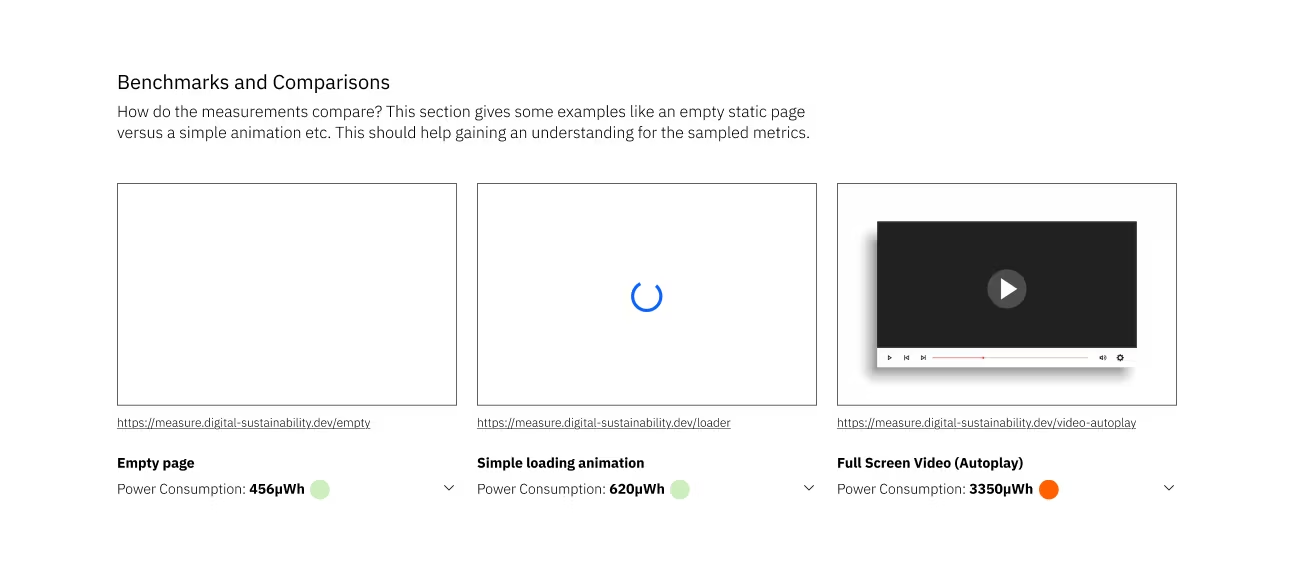
So far the web user interface is still very sparse. However, I intend to add more features. The site should give users the possibility to compare their metrics against averages of other sites or against best practices. Also seing bad examples with their energy usage can help improving a design. Furthermore I would like to add benchmarks. For example an empty page, with black or white background. A simple page with just a loading animation. A page with autoplayed video or audio for comparison. Only then one can really get a feeling for how different design decisions impact power consumption on the client side.
Other things I plan to implement:
- Include information about the browsers viewport when measuring.
- Write down benchmarks if I measure the page with just the firefox running and no background applications (like my service waiting and corresponding to incoming requests). If there is a substantial difference, I need to subtract the baseline from the measurement.
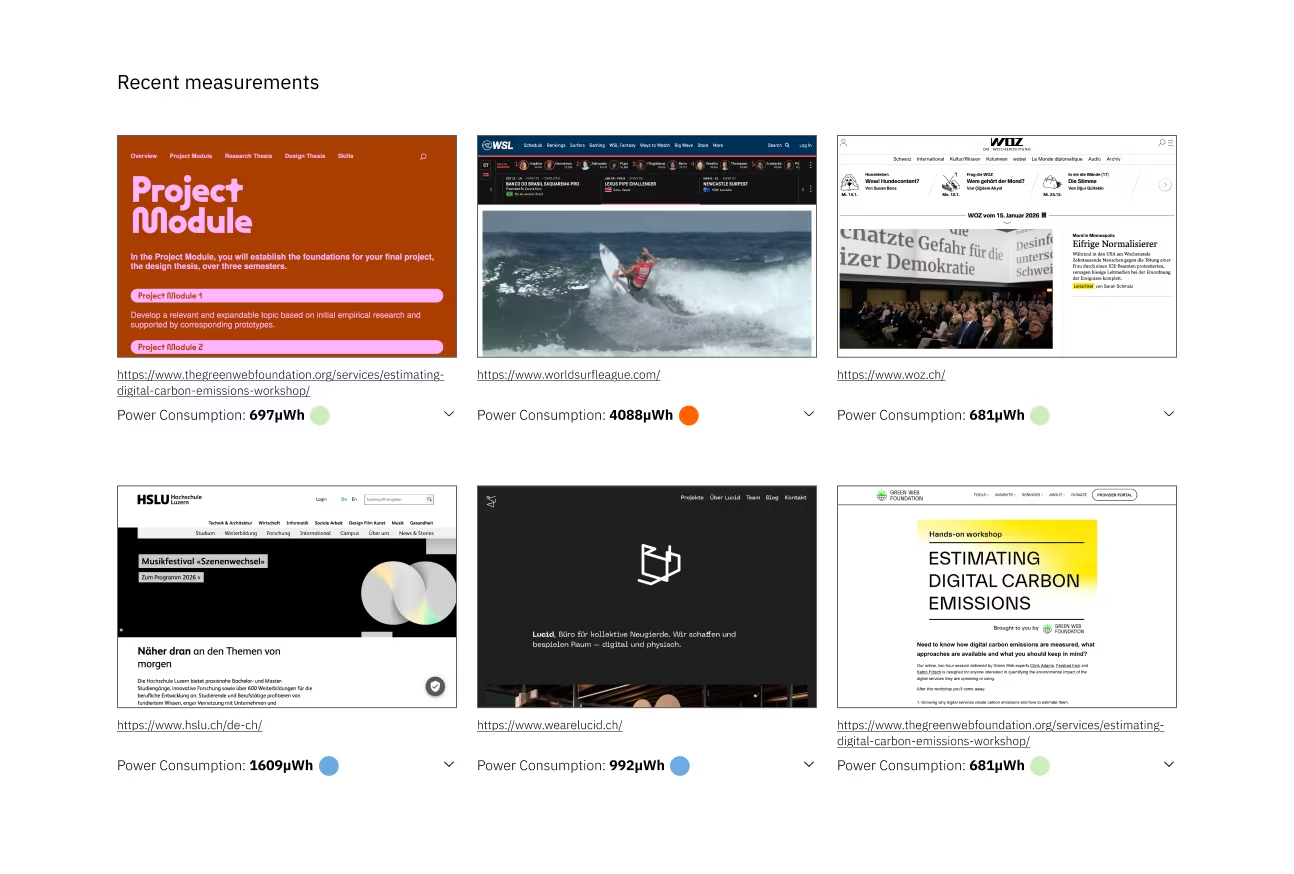
- Have a list of recent measurements including screenshots and metrics.
- Make sure the automated firefox instance is playing sound if a page with audio is loaded.
- Indicate and standardize how long a page is measured. Right now it is approximately 20s, but that can vary depending on how long the page needs to load.
- Maybe add options for users to send more specific requests. For example measure over a longer time period.
- Add some way to monitor my service, without adding more load to the Mac Mini which should be as idle as possible when measuring.
- Making open-source repository ready for contributions and write more extensive documentation for other people to set up their own power measurement proxy.
Links
- Power Measurement Proxy Web Interface:
https://measure.digital-sustainability.dev - Firefox Profiler Documentation:
https://profiler.firefox.com/docs/#/ - Cloudflare tunnels:
https://developers.cloudflare.com/cloudflare-one/networks/connectors/cloudflare-tunnel/ - Measuring Carbon Emissions in Browser DevTools with Firefox Profiler and CO₂.js:
https://www.thegreenwebfoundation.org/news/carbon-emissions-in-browser-devtools-firefox-profiler-and-co2-js/ - sitespeed.io:
https://www.sitespeed.io/ - Browsertime Documentation:
https://www.sitespeed.io/documentation/browsertime/introduction/ - Express.js:
https://expressjs.com/ - GitHub Repository of the Power Measurement Proxy:
https://github.com/Jones-S/power-measurement-proxy